Codebase-aware AI debugging is defined as the practice of indexing your project's source files into a semantic retrieval layer so an AI assistant can reason over relevant code rather than guessing from generic patterns. When you read codebase with an AI debugging assistant, tools like DebugAI and Claude Code retrieve only the files that matter for a given error, then pass that focused context to the language model. This approach, formally called retrieval-augmented code analysis, produces fixes tied to your actual architecture instead of textbook examples. The difference between a hallucinated suggestion and a precise patch almost always comes down to how well the AI has indexed and retrieved your code before answering.
How codebase-aware AI debugging assistants index and retrieve relevant code
Codebase-aware AI debugging indexes your entire project and retrieves semantically relevant code chunks when analyzing errors. That single capability separates purpose-built debugging tools from general-purpose chat assistants, which rely on whatever you paste into the prompt.
The indexing process works in four stages:
- File scanning. The tool walks your project tree and reads source files while skipping node_modules, build artifacts, and binary assets. DebugAI applies this filtering by default, which is why a mid-size project of 500 to 2000 files indexes in roughly 30 to 60 seconds. Speed matters here because slow indexing discourages developers from keeping the index current.
- Embedding generation. Each code chunk is converted into a vector using an embedding model trained on code semantics. These models understand that a Python "try/except
block and a JavaScripttry/catch` block share structural meaning, so retrieval works across language idioms. - Vector storage. Embeddings are stored locally in a vector database. DebugAI uses ChromaDB for this, which means your source code never leaves your machine. That privacy guarantee matters for teams working on proprietary systems.
- Semantic retrieval. When you submit an error, the tool converts the stack trace and error message into a query vector, then pulls the top-matching code chunks. Embedding models map code and error semantics to vectors, so related files surface even when they are not named in the error message.
| Stage | What happens | Why it matters |
|---|---|---|
| File scanning | Walks project tree, skips irrelevant files | Keeps index lean and fast |
| Embedding generation | Converts code chunks to semantic vectors | Enables meaning-based retrieval |
| Vector storage | Saves embeddings locally in ChromaDB | Preserves code privacy |
| Semantic retrieval | Matches error query to relevant chunks | Delivers precise, project-specific context |
Pro Tip: Run your initial index immediately after cloning a repo or pulling a major branch update. Stale indexes are the single most common cause of off-target AI suggestions.

What strategies work best for managing context in large codebases
Managing context is where most developers lose productivity when using AI code analysis tools. Sending an entire repository to an LLM is not just slow. It actively degrades response quality by flooding the model with irrelevant code.

The most effective technique is progressive disclosure. Sharing 3 to 5 relevant files plus error logs outperforms full repo dumps in both accuracy and token efficiency. Start by sharing only the file where the error originates, then let the AI ask for additional files as it traces the call chain. This mirrors how a senior engineer investigates a bug: read the stack trace, open the offending file, then follow imports.
Architecture context files like CLAUDE.md serve as orientation documents for the AI. A well-written CLAUDE.md describes your module structure, naming conventions, and key entry points in under 200 lines. Concise, human-written instructions modularized by concern perform better than long, sprawling rules files because the model can apply scoped guidance without filtering noise.
Token limits are a real constraint during long debugging sessions. Claude Code's /compact command summarizes conversation history into a compressed representation, freeing context window space for new code. Managing token budgets with progressive disclosure and context compaction keeps AI assistants effective across sessions that span hours rather than minutes.
Key practices for context management:
- Keep your CLAUDE.md or equivalent context file under 200 lines and update it when architecture changes.
- Share files in order of relevance: error file first, then direct dependencies, then utilities.
- Use
/compactor equivalent commands before adding new modules to a long session. - Avoid pasting entire configuration files unless the bug is explicitly configuration-related.
- Restart context with a clean summary when a session exceeds 20 back-and-forth exchanges.
Pro Tip: Write your architecture context file as if you are onboarding a new engineer in 10 minutes. If it takes longer to read than that, it is too long for an AI to use effectively.
How graph-based tools improve structural analysis during AI debugging
Vector embeddings handle semantic similarity well, but they do not capture structural relationships like call graphs, inheritance chains, or module dependency trees. Graph-based knowledge tools fill that gap by building an AST-derived map of your codebase that AI clients can query directly.
MCP (Model Context Protocol) servers act as a structured interface between your codebase graph and the LLM. Instead of sending raw file content, the AI client sends a query like "show me all callers of processPayment()" and receives a compact, token-efficient answer. Codebase-memory-mcp builds persistent SQLite graphs exposing tasks like call path tracing and dead code detection. This means the LLM spends its context window on reasoning rather than parsing file content.
Tools like tree-sitter parse source files into abstract syntax trees that capture function signatures, class hierarchies, and import relationships. GitCortex takes this further by integrating with git hooks so that local graphs update in under 500ms after file changes. That speed makes the graph reliable even during active development sprints where files change frequently.
| Tool | Approach | Best for |
|---|---|---|
| codebase-memory-mcp | SQLite call graphs via MCP | Call path tracing, dead code detection |
| GitCortex | Git-hook-triggered diff updates | Keeping graphs fresh during active dev |
| spy-code | AST-based structural queries | Module dependency and impact analysis |
Separating structural analysis backends from the LLM intelligence layer reduces redundant API calls and improves precision on structural queries. Large monorepos benefit especially from token-optimized call graphs or logic skeleton views rather than raw file content, because the model can reason about blast radius without reading every affected file.
Pro Tip: Use a graph-based tool for impact analysis before applying any fix. Knowing which modules call the function you are changing prevents regression bugs that vector-only tools miss.
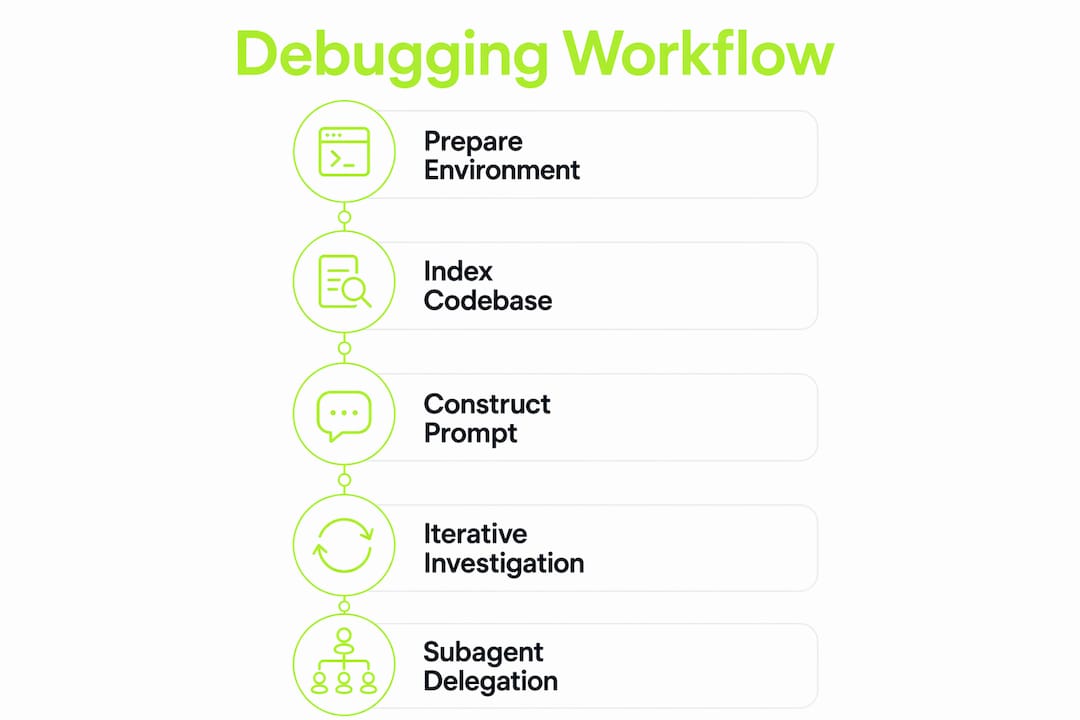
Step-by-step guide to reading and debugging a codebase with AI
A structured workflow prevents the fix-break-fix loops that waste hours of developer time. Cursor's debugging modes separate ask, debug, and fix steps to enforce this discipline. Apply the same separation regardless of which AI assistant you use.
Step 1: Prepare your environment. Create or update your architecture context file. Confirm your vector index is current. If you use a graph-based tool, verify the last update timestamp.
Step 2: Index or refresh. Trigger a full index on first use or after major refactors. For daily work, incremental indexing handles updates automatically. Check that your .gitignore equivalent is configured so the indexer skips generated files.
Step 3: Construct your prompt. Effective debugging prompts include the stack trace, bug report, reproduction steps, and suspected entry point files. Paste the full stack trace, describe the expected versus actual behavior, and name the file where execution enters the problematic path. Do not ask the AI to "look at my code." Give it a specific question.
Step 4: Iterative investigation. Let the AI identify the probable cause, then share the next relevant file it requests. Resist the urge to dump everything at once. Each exchange should narrow the hypothesis, not broaden it.
Step 5: Parallel subagent investigation for multi-module bugs. Claude Code supports subagent delegation, spawning parallel agents to explore different parts of a bug chain simultaneously. Use this when a bug spans authentication, database, and API layers. Each subagent focuses on one module, then reports findings back to the orchestrating session.
Step 6: Apply and verify. Apply the suggested fix to a branch. Run your test suite. If tests pass, check the AI-generated debugging steps against your original reproduction steps to confirm the root cause was addressed, not just the symptom.
Common mistakes to avoid:
- Accepting the first suggested fix without reading it. AI assistants can produce plausible-looking but incorrect patches.
- Skipping the verification step when the error disappears. Symptoms can resolve while the root cause remains.
- Using the same session for unrelated bugs. Context from one bug contaminates reasoning about another.
Common challenges when using AI assistants to read complex codebases
Even well-configured AI debugging workflows hit predictable obstacles. Knowing them in advance cuts troubleshooting time significantly.
Index staleness is the most frequent problem. Files change constantly during active development, and an index from three hours ago may not reflect the current call graph. Integrate indexing with file watchers or git hooks so incremental updates trigger automatically on code changes. Manual re-indexing is a habit that breaks under deadline pressure.
Context degradation happens in long sessions. After many exchanges, the model's effective attention shifts toward recent messages and away from earlier context. Compact the session before it reaches this point, or start a fresh session with a structured summary of findings so far.
Hallucinated fixes occur when the AI lacks sufficient context and fills the gap with plausible-sounding code that does not match your architecture. The fix is almost always more context, not a different model. Check whether the relevant files were actually retrieved before assuming the model is wrong.
The best defense against hallucinated suggestions is a well-maintained index and a prompt that includes the stack trace, the entry point file, and a clear statement of expected behavior. Vague prompts produce vague answers.
Fragmented or monolithic files create retrieval problems at both extremes. A 5,000-line utility file contains too many unrelated concepts for the embedder to produce a useful vector. A project split into hundreds of 20-line files creates retrieval noise. Aim for files that represent a single coherent concern, which also happens to be good software design.
For codebase documentation and AI assistance to work together, keep your architecture docs and your index synchronized. Outdated documentation misleads the AI just as much as a stale vector store.
Key takeaways
Effective AI-assisted codebase reading requires a current semantic index, progressive context disclosure, and structured prompts that include stack traces and entry point files.
| Point | Details |
|---|---|
| Index before you debug | Run semantic indexing on your project before starting any debugging session to get accurate retrieval. |
| Use progressive disclosure | Share 3 to 5 relevant files rather than full repos to improve AI accuracy and reduce token waste. |
| Add graph-based tools for structure | MCP servers and AST graphs handle call chains and impact analysis that vector search alone cannot. |
| Prompt with full error context | Include stack traces, reproduction steps, and entry point files in every debugging prompt. |
| Compact long sessions | Use context compaction commands before token limits degrade AI reasoning quality. |
Why context engineering is the real skill here
Most developers I work with focus on choosing the right AI tool and then wonder why results are inconsistent. The tool matters far less than how you prepare the context it receives. I have seen teams switch from one AI code analysis tool to another three times in a year without improving their debugging speed, because the underlying problem was always a stale index and vague prompts.
The investment that pays off is upfront context engineering: a tight architecture file, a current index, and the discipline to share files progressively. Once those habits are in place, almost any capable AI assistant produces reliable results. The benefits of AI code reading tools only materialize when the retrieval layer is trustworthy.
I am also skeptical of the idea that subagents and parallel investigation are only for large teams. A solo developer working on a 50,000-line codebase benefits just as much from spawning a subagent to trace the database layer while the main session focuses on the API. The cognitive load reduction is real regardless of team size.
The future direction is clear: AI assistants will move from file-level retrieval toward full program comprehension, understanding runtime behavior and not just static structure. But that future depends on the same foundation. Clean indexes, focused prompts, and structured workflows will remain the deciding factor between an AI that accelerates your work and one that generates plausible noise.
— Dizzy
How Coevy helps your team debug with full codebase context
Debugging complex issues gets faster when your AI assistant actually reads your source code instead of guessing from documentation.
Coevy's AI agent indexes your actual codebase to deliver precise answers and codebase-aware debugging support tied to your real architecture. It attaches session replays, reproduction steps, and contextual code references automatically, so your team spends less time reproducing bugs and more time fixing them. Combined with auto-tagging, prioritization, and GDPR-compliant session data, Coevy gives you a single platform for feedback collection, issue tracking, and AI-powered code assistance. Try Coevy and see how codebase-aware AI cuts your debugging cycle from hours to minutes.
FAQ
What is a codebase-aware debugging tool?
A codebase-aware debugging tool indexes your project's source files into a semantic retrieval layer and pulls relevant code chunks when analyzing errors. Unlike generic AI chat tools, it reasons over your actual architecture rather than producing pattern-matched suggestions.
How do I read a large codebase with an AI debugging assistant?
Start by indexing your project with a tool like DebugAI or Claude Code, then submit your stack trace alongside 3 to 5 relevant files. Use progressive disclosure to share additional files as the AI narrows its hypothesis rather than dumping the entire repo at once.
What are the best codebase-aware AI debugging tools in 2026?
DebugAI, Claude Code, and graph-based MCP tools like codebase-memory-mcp and GitCortex each address different aspects of codebase reading. DebugAI excels at local semantic indexing with ChromaDB, while Claude Code supports subagent delegation for multi-module bugs.
How do I prevent hallucinated fixes from AI debugging assistants?
Hallucinations drop significantly when you provide a complete prompt that includes the stack trace, expected versus actual behavior, and the entry point file. A current semantic index also reduces hallucinations by giving the model accurate project context instead of forcing it to fill gaps.
How often should I re-index my codebase for AI debugging?
Incremental indexing triggered by file watchers or git hooks keeps your index current automatically. For projects using GitCortex, graph updates run in under 500ms after each file change, so manual re-indexing is only needed after major refactors or initial setup.