AI surfaces product improvement signals by synthesizing user feedback, behavioral data, and business metrics into statistically significant patterns that reveal what to fix and why it matters. The industry term for this process is AI-driven signal detection, and it sits at the core of modern product discovery. Understanding how ai surfaces product improvement signals separates teams that ship the right features from teams that ship the loudest requests. Unilever's product teams now analyze consumer insights 60% faster using AI, cutting formulation cycles from five or six rounds down to one or two. That kind of speed is only possible when AI handles the signal detection work that would otherwise take weeks of manual review.
How AI surfaces product improvement signals from raw data
AI-driven signal detection works by pulling from multiple data sources simultaneously, then applying machine learning models to find patterns no single analyst could spot manually. The inputs fall into two broad categories: explicit feedback and behavioral data. Explicit feedback includes app store reviews, NPS open-text responses, support tickets, and in-app survey answers. Behavioral data includes session replays, feature usage frequency, drop-off points, and churn correlation metrics.
The explicit feedback layer
Explicit feedback is the most obvious signal source, but it is also the noisiest. A single app store review carries little weight. When AI clusters 2,000 reviews and finds that 240 responses share a statistically significant pattern, that cluster becomes a real signal. Manual review of the same dataset would likely dismiss those 240 responses as scattered complaints.
The behavioral data layer
Behavioral signals are quieter but often more reliable. Session replays show where users hesitate, rage-click, or abandon a flow entirely. Feature usage data reveals which parts of your product users avoid after the first week. Churn correlation models connect specific in-app behaviors to subscription cancellations, giving product teams a direct line between user friction and revenue loss.

The implicit signal layer
The most underused signal source is what researchers call the "dark matter" of product development. 80% of product signals are implicit, buried in Jira ticket clusters, Slack threads, CRM notes, and internal engineering discussions. Most AI feedback tools never touch this data. Teams that build pipelines to analyze these sources gain a significant advantage in catching problems before they reach customers.
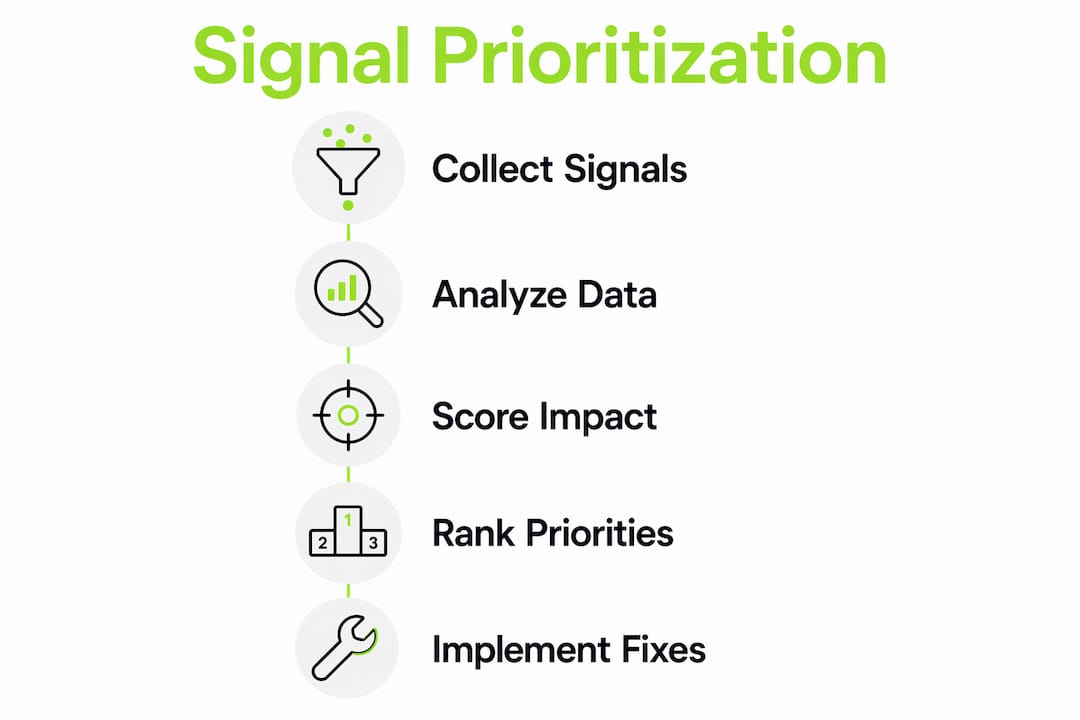
How does AI process and prioritize these signals?
Raw signal volume is not useful on its own. A product team receiving 10,000 feedback items per month needs AI to rank those items by business impact, not just frequency. The processing pipeline typically runs through four stages: sentiment analysis, theme extraction, entity mapping, and priority scoring.
Sentiment analysis classifies each feedback item as positive, negative, or neutral, and assigns intensity scores. Theme extraction groups items into clusters around shared topics, such as "slow load times" or "confusing onboarding." Entity mapping connects themes to specific product areas, user segments, or account types. Priority scoring then ranks themes by their likely business impact.
The most rigorous priority scoring formula in current use comes from Lexsis AI:
- Identify complaint frequency for each theme across all feedback channels.
- Calculate churn correlation by comparing churn rates among users who reported the issue versus the baseline. A churn correlation multiplier of 2.3x means affected users churn at more than twice the normal rate.
- Estimate revenue at risk by multiplying affected accounts by average contract value.
- Divide the combined score by estimated implementation cost.
The resulting formula, (Complaint Frequency x Churn Correlation x Revenue at Risk) / Implementation Cost, converts qualitative feedback into a financial priority ranking. That ranking gives engineering and product teams a defensible reason to choose one fix over another.
Pro Tip: Run this formula quarterly, not just during planning cycles. Signals shift as your user base grows, and a low-priority issue in Q1 can become a critical churn driver by Q3.
The statistical significance point deserves emphasis. When AI thematic analysis surfaces a pattern in 240 out of 2,000 responses, that 12% concentration is meaningful. The same 240 complaints spread across a manual review process would appear as scattered noise. AI detects the concentration; humans without AI tools typically miss it.
| Approach | Signal Source | Output |
|---|---|---|
| Manual review | Support tickets, surveys | Subjective theme list |
| Basic AI tagging | Structured feedback forms | Categorized feedback buckets |
| AI-driven signal detection | All channels including behavioral | Ranked, impact-scored insight briefs |
What blind spots do AI systems have in signal detection?
AI signal detection is powerful, but it carries three consistent blind spots that product teams need to manage actively.
Volume bias over impact. Most AI tools rank signals by frequency. A feature request mentioned 500 times by free-tier users may score higher than a critical bug mentioned 20 times by enterprise accounts. Raw counts without account-level context produce false positives that send teams chasing low-value work. A 60% drop in active users within a single enterprise account is a more urgent signal than 500 low-stakes complaints, even though the count is far smaller.
Metric dilution in AI products. Teams building AI-powered features face a specific problem: rolling AI-specific metrics into general product funnel metrics obscures what is actually failing. Maintaining parallel AI context blocks in your event ingestion pipeline separates technical model errors from genuine user experience problems. Without that separation, a degraded AI model looks identical to a confused user in your analytics dashboard.
Missing the implicit signal layer. Standard feedback tools scan structured inputs. They do not read Jira ticket clusters, Slack threads, or email chains where engineers and support reps surface problems long before customers do. Advanced teams run AI analysis across Jira, Slack, and Confluence to detect convergent signals that typical tools miss entirely.
Pro Tip: Build a weekly "dark matter" review into your product process. Pull the top five Jira tickets by comment volume and cross-reference them against your AI-generated theme clusters. Convergence between the two is a strong signal of a real problem.
The fix for all three blind spots is the same: pair AI outputs with human product intuition. AI excels at summarization; humans are required to interpret context, weight business relationships, and decide when a signal demands immediate action versus further investigation. Treating AI as a "feedback CRM" rather than a decision-maker keeps the process honest.
How can product teams apply AI signals in real workflows?
Surfacing signals is only half the job. The other half is building workflows that turn those signals into shipped improvements. The most effective teams structure this as a continuous loop rather than a quarterly planning event.
Productboard Spark is the clearest current example of AI-powered synthesis in practice. The Productboard Spark workflow ingests dashboard data, identifies correlated charts, clusters qualitative feedback, and generates ranked insight briefs with citations back to the raw data. Product managers can trace every recommendation to its source, which makes prioritization decisions defensible to engineering and leadership.
The table below maps each team function to its role in an AI signal workflow:
| Team | Input to AI System | Output They Act On |
|---|---|---|
| Product | Roadmap priorities, user segments | Ranked insight briefs, theme clusters |
| Engineering | Bug reports, Jira tickets | Priority-scored fix list with churn impact |
| Support | Ticket volume, escalation patterns | Friction hotspots, auto-tagged categories |
| Research | Interview notes, survey responses | Validated themes with statistical weight |
Cross-referencing AI-generated signals with raw customer data is non-negotiable. An AI system might cluster 300 feedback items under "reporting is too slow." Before scheduling engineering work, a product manager should pull the actual accounts behind those 300 items, check their contract values, and confirm whether the issue correlates with churn. That cross-reference takes 20 minutes and prevents months of misallocated work.
Coevy's AI tagging for feedback fits directly into this workflow by categorizing incoming feedback automatically, so product teams spend time on analysis rather than sorting. For teams managing AI in product backlog management, connecting tagged signals to backlog items closes the loop between user feedback and engineering priorities.
Building AI governance into product processes from the start is far easier than retrofitting it later. Teams that define how AI signals feed into sprint planning, OKRs, and roadmap reviews from day one avoid the chaos of trying to integrate AI outputs into a process that was never designed for them.
Key takeaways
AI-driven signal detection works when teams combine machine learning outputs with account-level context, implicit data sources, and human judgment to prioritize improvements by business impact rather than complaint volume.
| Point | Details |
|---|---|
| Explicit plus behavioral data | Combine survey feedback, session replays, and churn metrics for complete signal coverage. |
| Impact scoring over frequency | Use the (Complaint Frequency x Churn Correlation x Revenue at Risk) / Implementation Cost formula to rank fixes. |
| Dark matter signals matter | Analyze Jira, Slack, and CRM data to catch the 80% of signals standard tools miss. |
| Account-level context reduces false positives | A single enterprise account's churn signal outweighs hundreds of low-stakes complaints. |
| Human judgment closes the loop | AI summarizes patterns; product managers must interpret context and make the final call. |
The part most teams get wrong
I have watched product teams adopt AI feedback tools with genuine enthusiasm, then six months later wonder why their roadmap still feels reactive. The problem is almost never the tool. It is the mental model.
Most teams treat AI signal detection as a replacement for product intuition. They see a ranked list of themes and assume the ranking is the decision. It is not. The ranking is a starting point. A theme labeled "dashboard performance" might represent a cosmetic annoyance for 400 users or a contract-threatening failure for three enterprise accounts. The AI cannot tell you which one it is without account-level context layered on top.
The teams I have seen get this right share one habit: they use AI to generate hypotheses, not conclusions. They take the top three themes from their AI system, pull the raw feedback behind each one, call two or three affected customers, and then decide. That loop takes a week. It prevents months of building the wrong thing.
The other mistake I see constantly is ignoring the signal hierarchy in favor of whatever is loudest. Weak situational signals, a spike in support tickets after a release, a dip in feature adoption, get treated as urgent. Strong business outcome signals, churn correlation, revenue at risk, expansion blockers, get buried in a spreadsheet. AI is only as useful as the framework you use to interpret its outputs. Build the framework first, then let the AI feed it.
— Dizzy
Capture friction signals before they become churn
The workflows described in this article depend on one thing: capturing signals at the moment they happen, not days later in a support ticket. Coevy is built for exactly that moment.
Coevy's embedded widget captures user feedback, session replays, and bug reports directly inside your web app, with AI-generated reproduction steps attached automatically. Auto-tagging and priority scoring mean your team sees ranked signals within minutes of capture, not after a manual triage cycle. For product teams that want to move from reactive to proactive, start with Coevy and see how real-time friction capture changes what your roadmap looks like.
FAQ
What types of data does AI analyze for product signals?
AI analyzes explicit feedback such as reviews, NPS responses, and support tickets, alongside behavioral data including session replays, feature usage, and churn patterns. It also processes implicit signals from Jira tickets, Slack threads, and CRM notes when teams build pipelines to include them.
How does AI prioritize product improvement signals?
AI applies impact scoring formulas that weight complaint frequency, churn correlation, and revenue at risk against implementation cost. The Lexsis AI formula, (Complaint Frequency x Churn Correlation x Revenue at Risk) / Implementation Cost, is a widely used example of this approach.
What percentage of product signals do standard AI tools miss?
Standard AI feedback tools miss approximately 80% of product signals because those signals are implicit, buried in internal tools like Jira, Slack, and email threads rather than structured feedback forms.
How does productboard use AI for product discovery?
Productboard Spark synthesizes qualitative and quantitative data into prioritized insight briefs with citations back to raw data, allowing product managers to trace every recommendation to its source before making roadmap decisions.
Should product teams rely entirely on AI for signal detection?
No. AI excels at summarizing patterns across large datasets, but human product intuition is required to interpret account-level context, weight business relationships, and validate signals through direct customer conversations before acting on them.