AI-generated debugging steps are defined as structured, evidence-backed troubleshooting sequences produced by layered AI systems that observe runtime data, analyze code context, generate ranked hypotheses, and verify fixes before surfacing recommendations to developers. Tools like Claude Code, multi-agent debugger frameworks, and Chrome DevTools for agents represent the current state of the art in automated debugging with AI. This article breaks down exactly how these systems work, from the first log ingestion to the final regression test, so your team can use them with confidence rather than treating them as black boxes.
How AI generates debugging steps: the core architecture
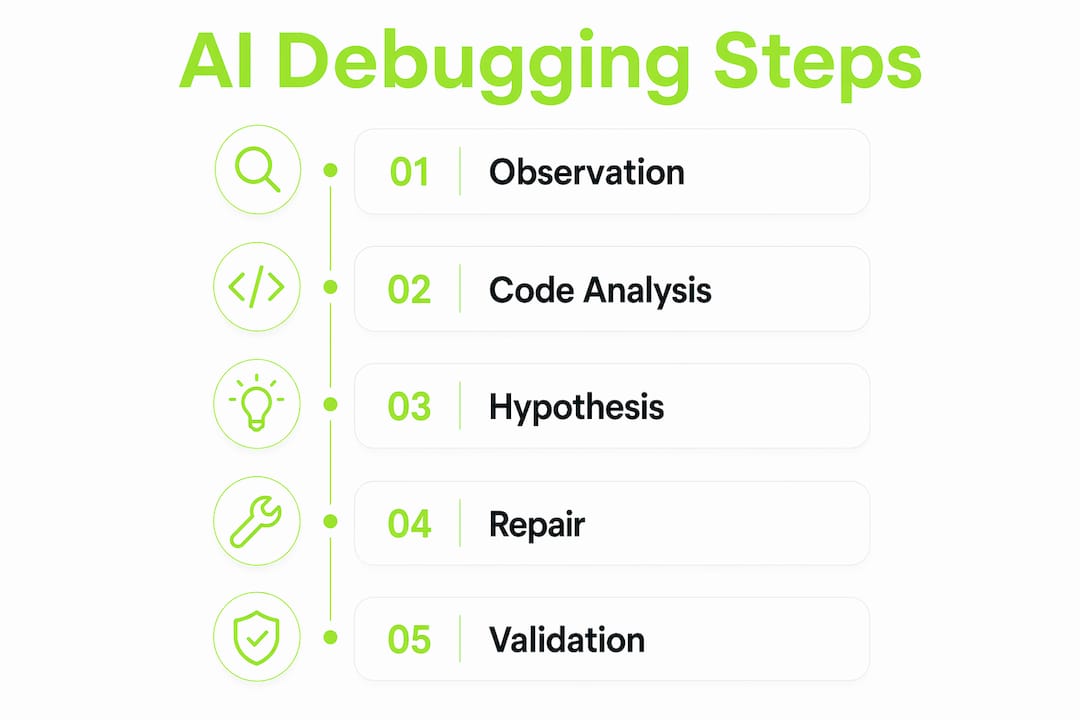
The foundation of how AI generates debugging steps is a three-layer architecture: an Observation Layer, a Code Understanding Layer, and a Hypothesis-Generation and Repair Loop. Each layer feeds the next, and the entire pipeline is designed to produce falsifiable, testable debugging actions rather than vague suggestions.
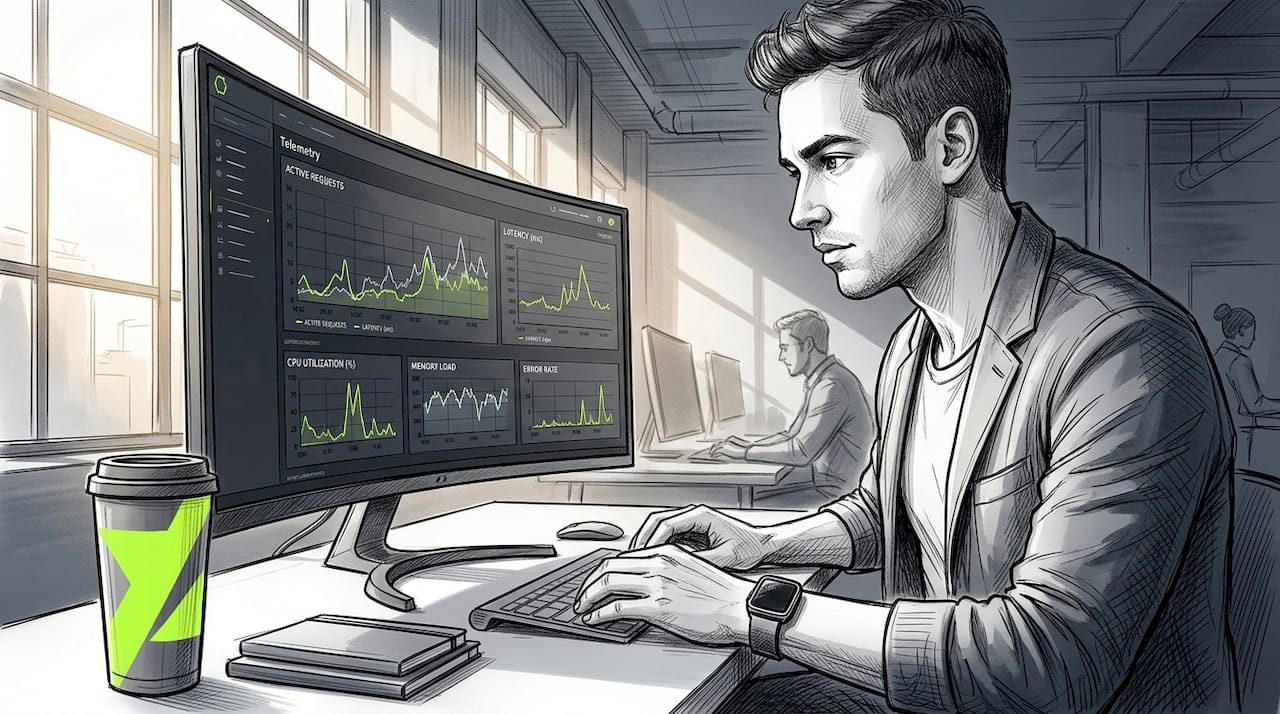
The Observation Layer ingests telemetry including logs, metrics, stack traces, and test failures. This raw data is the AI's sensory input. Without it, every downstream step is guesswork. The Code Understanding Layer then applies large language models to perform static abstract syntax tree (AST) analysis and correlate dynamic execution traces against the codebase. This is where the AI builds a mental model of what the code is supposed to do versus what it actually did.
The Hypothesis-Generation and Repair Loop is where debugging steps are actually produced. The AI generates two to four ranked hypotheses per bug, each tied to specific evidence from the observation and code analysis phases. It then validates potential fixes with targeted tests before passing results to a human reviewer. This human-in-the-loop review step is not optional. It provides feedback that continuously improves the AI's accuracy over time.
Pro Tip: Before deploying any AI debugging workflow, confirm your observability stack exports structured logs. Unstructured log output forces the AI to spend cycles on parsing rather than analysis, which degrades hypothesis quality.
The codebase-aware AI support model takes this further by grounding the AI's analysis in actual source code rather than documentation, which is where most AI debugging tools fall short.

How AI debugging systems formulate and validate hypotheses
The most rigorous AI debugging technique in production today follows a six-phase loop: hypothesize, instrument, reproduce, converge, fix, and clean up. This is not theoretical. The Debug Probe agent skill implements exactly this sequence for Claude Code, and it produces reliable debugging steps because every phase is falsifiable.
Here is how each phase works in practice:
- Hypothesize. The AI generates two to four specific, falsifiable hypotheses per bug. Each hypothesis names a concrete mechanism, such as a race condition in an async queue or a null reference from an unvalidated API response.
- Instrument. The AI adds targeted log points, typically three to five per hypothesis. Over-instrumentation is a known failure mode. Minimal, targeted instrumentation keeps signal-to-noise high and avoids misleading results.
- Reproduce. The AI attempts to reproduce the failure under controlled conditions. Reproduction is the only way to confirm a hypothesis is worth pursuing.
- Converge. Log output is matched against each hypothesis. The AI scores each candidate by how well the observed behavior fits the predicted pattern.
- Fix. The highest-scoring hypothesis drives the repair. Claude Code ranks likely root causes with probabilities and generates regression tests alongside the fix to prevent recurrence.
- Clean up. Instrumentation is removed entirely. Skipping cleanup introduces performance degradation and can trigger new failures, making this the most overlooked step in AI-assisted debugging.
Pro Tip: If your AI debugger does not produce a cleanup phase, treat its output as a draft, not a finished fix. Leftover instrumentation in production is a reliability risk.
AI excels at transforming unstructured bug reports into structured investigation plans with ranked hypotheses and regression test generation. This is the clearest productivity gain AI brings to debugging workflows.
What role do behavioral contracts play in AI-generated debugging steps?
Behavioral contracts reframe debugging steps as verifiable units of observable behavior rather than code-level changes. The AI-native step tracing approach defines step size not by lines of code but by whether a meaningful, observable data change occurs at the boundary of each step.
Each step is wrapped with a tracer that records:
- Input values at the start of the step
- Output values at the end
- Duration in milliseconds
- Success or failure status
Verification then compares observed behavior against the expected contract. If the output matches the contract, the step is valid. If it does not, the discrepancy is the bug. This approach catches issues that static code review misses entirely, including concurrency bugs, timing-dependent failures, and subtle state mutations.
The table below shows how behavioral contract verification compares to traditional code review for common bug categories:
| Bug category | Code review detection | Behavioral contract detection |
|---|---|---|
| Race conditions | Rarely caught | Caught via timing and output divergence |
| Null reference errors | Sometimes caught | Caught via input/output mismatch |
| Async boundary failures | Rarely caught | Caught via duration and success flags |
| Logic errors in loops | Often caught | Caught via output contract violation |
Verifying AI code by behavior rather than reading it also mitigates hallucinations, which is the single biggest reliability risk in AI-driven software troubleshooting. When the AI must cite deterministic, verified evidence from actual runtime behavior, it cannot fabricate line numbers or variable names. The deterministic evidence sandwich approach formalizes this constraint by requiring all AI claims to be validated against real code facts before they surface as debugging steps.
How multi-agent collaboration improves debugging step generation
Multi-agent AI debugger systems decompose the debugging problem into specialized subtasks, each handled by a dedicated agent. The multi-agent debugger architecture uses distinct agents for question parsing, log analysis, code path analysis, root cause synthesis, and visual output generation.
This specialization matters because no single model excels at all of these tasks simultaneously. A log analysis agent trained on error pattern recognition performs better than a general-purpose LLM asked to do everything at once. The code path agent extracts and validates execution paths dynamically from stack traces, confirming that the path the AI describes actually exists in the codebase.
The root cause synthesis agent produces confidence-ranked narratives. Rather than presenting a single answer, it outputs something like: "Race condition in the payment queue processor (78% confidence), followed by unhandled promise rejection in the notification service (15% confidence)." This gives your team a prioritized investigation order rather than a single bet.
Visual output is a frequently underestimated feature. The multi-agent debugger generates Mermaid diagrams that map the failure flow from trigger to symptom. These diagrams are shareable in pull requests and incident postmortems, which reduces the time spent explaining a bug to stakeholders who were not in the debugging session.
Multi-agent systems also use counterfactual replay to distinguish causation from correlation. By pausing execution, forking the state, and comparing outcomes under different conditions, the system produces empirically grounded debugging steps rather than pattern-matched guesses.
How developers validate AI-generated debugging steps in production
Trust in AI assistance in bug fixing is earned through reproducibility, not confidence scores. The most reliable validation method is replaying the full execution trace in a sandbox environment, then stepping through each AI-generated debugging action to confirm it produces the predicted state change.
Production AI debugging relies on replay environments that allow step-by-step fault analysis. Failing steps are automatically converted into evaluation test cases, which feeds directly into CI quality gates. If the AI's debugging quality score drops below a defined threshold, the merge is blocked. This is automated debugging with AI operating at the process level, not just the code level.
Chrome DevTools for agents adds another layer of runtime validation. The stable DevTools 1.0 release supports heap snapshots for memory leak detection, runtime network request capture, and console log inspection, all accessible to AI agents programmatically. This gives AI debuggers the same real-time context a senior developer would use during a manual debugging session.
Pro Tip: Set up a dedicated replay environment before you need it. Teams that build replay infrastructure after an incident spend the first hour of the incident building tooling instead of debugging.
The AI bug prioritization layer sits on top of all of this, ensuring that the bugs your AI debugger tackles first are the ones with the highest production impact. Prioritization without debugging context is noise. Debugging without prioritization is inefficiency.
For teams working with AI API integrations, debugging tools for AI APIs provide additional techniques for replaying execution traces and validating AI-generated steps in integration-heavy environments.
Key takeaways
AI generates debugging steps through a layered architecture that combines runtime observation, code analysis, hypothesis testing, and behavioral verification to produce structured, falsifiable troubleshooting sequences.
| Point | Details |
|---|---|
| Three-layer architecture | Observation, Code Understanding, and Hypothesis-Repair layers work in sequence to produce evidence-backed steps. |
| Six-phase hypothesis loop | Hypothesize, instrument, reproduce, converge, fix, and clean up produces reliable steps with mandatory instrumentation removal. |
| Behavioral contracts | Wrapping steps with input/output tracers catches concurrency and async bugs that static code review misses. |
| Multi-agent specialization | Dedicated agents for log analysis, code path validation, and root cause synthesis outperform single-model approaches. |
| CI gating for trust | Replay environments and quality-scored CI gates prevent low-confidence AI debugging steps from reaching production. |
Why AI debugging is still a co-pilot problem
I have spent enough time watching teams adopt AI debugging tools to say this plainly: the teams that get the most out of AI-driven software troubleshooting are the ones that treat the AI as a first-pass analyst, not a final authority. The six-phase hypothesis loop is genuinely impressive. The multi-agent architectures are producing root cause analyses that would take a senior engineer an hour to assemble manually. But I have also seen AI debuggers confidently identify the wrong root cause because the log coverage was thin and the hypothesis space was too narrow.
The behavioral contract approach is the most underused technique in this space. Most teams are still reading AI-generated code rather than observing its behavior. That is backwards. When you wrap steps with tracers and compare outputs against contracts, you stop arguing about whether the AI's suggestion is correct and start measuring whether it is correct. That shift from opinion to observation is where AI assistance in bug fixing actually delivers on its promise.
The cleanup phase is the other thing I would push every team on. Instrumentation left in production after a debugging session is a slow-motion reliability problem. It is also a signal that the team is treating AI debugging as a one-shot tool rather than a disciplined workflow. The teams doing this well have cleanup as a required step in their definition of done, not an afterthought.
— Dizzy
How Coevy fits into your AI debugging workflow
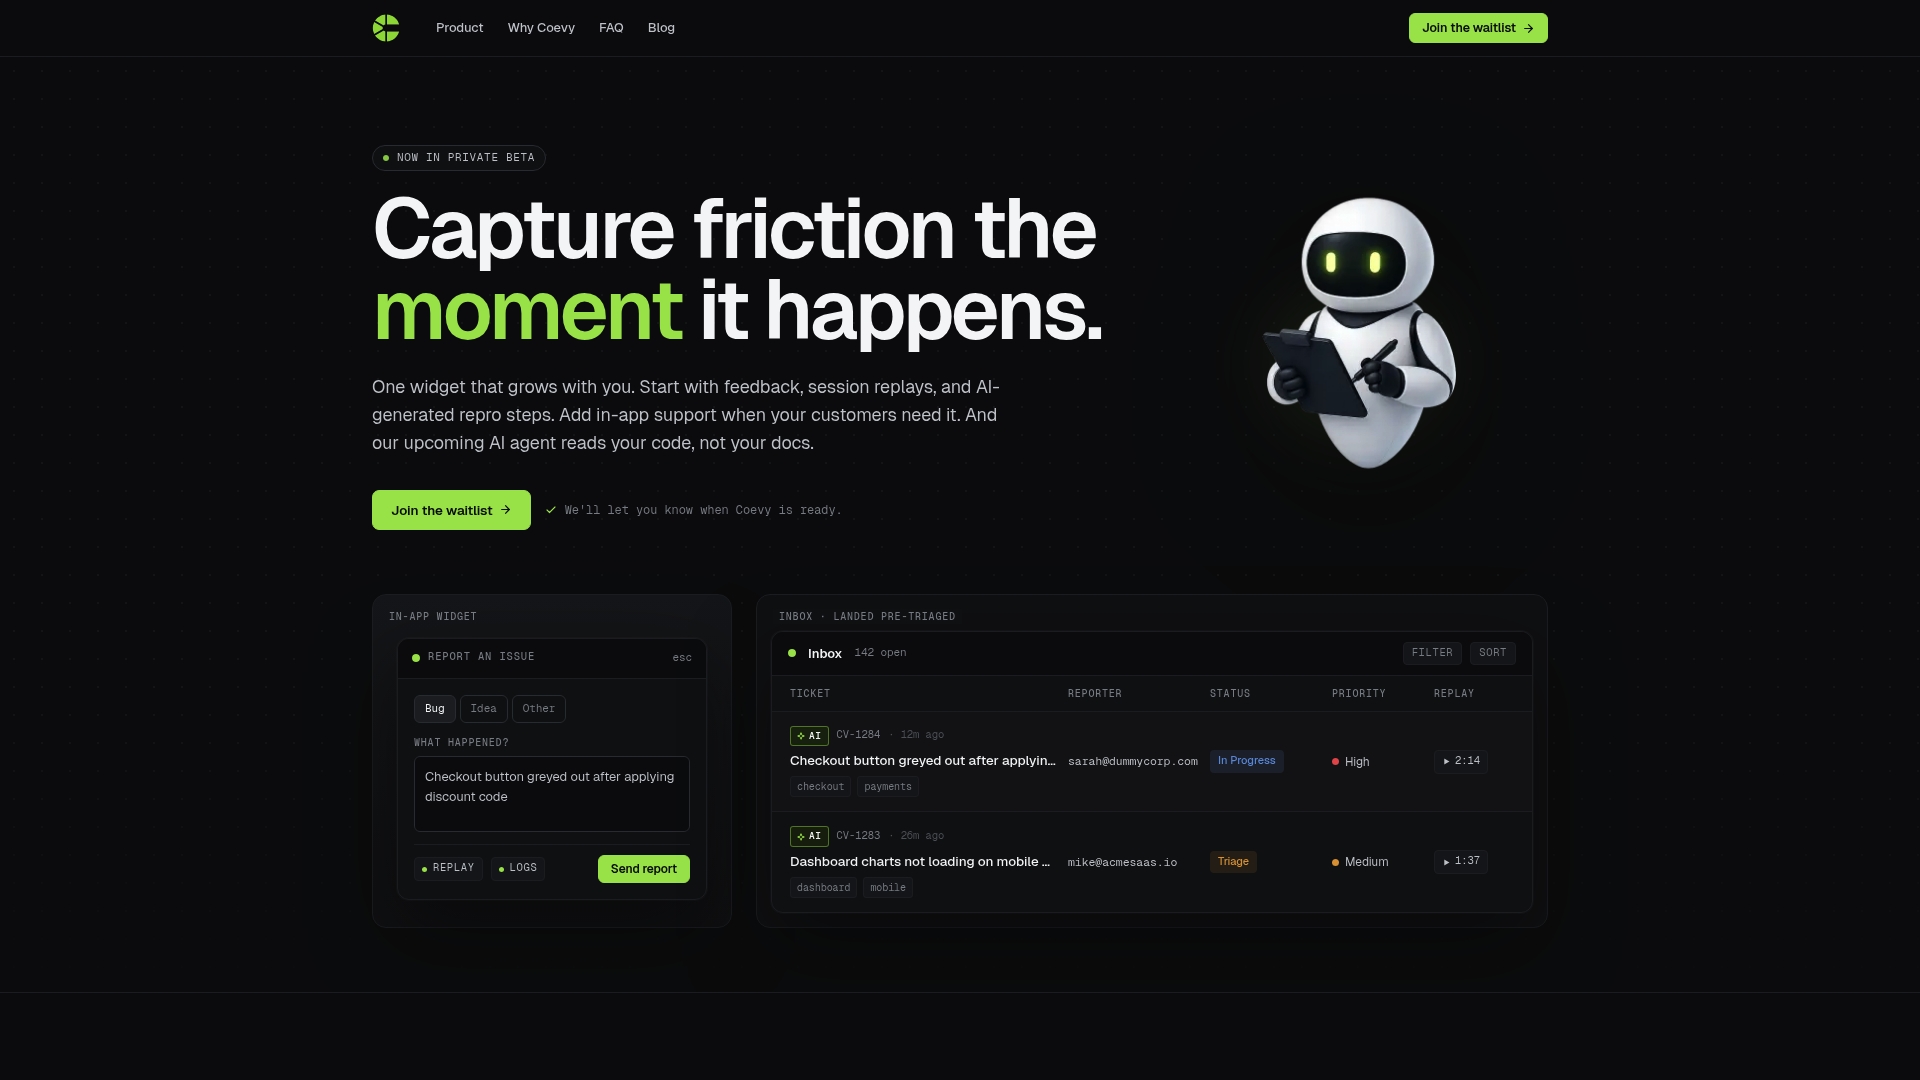
Coevy captures friction the moment it happens by attaching session replays, structured reproduction steps, and contextual telemetry directly to bug reports inside your web app. Instead of chasing down logs after the fact, your team gets the observational data the AI needs to generate accurate debugging steps from the first report. Coevy's codebase-aware AI features read actual source code rather than documentation, which grounds every debugging suggestion in real structural facts. For teams scaling their debugging workflows without scaling their support headcount, Coevy provides the evidence layer that makes AI-generated debugging steps trustworthy rather than theoretical.
FAQ
How does AI generate debugging steps from a bug report?
AI transforms unstructured bug reports into structured investigation plans by ingesting logs and telemetry, analyzing code context with LLMs, and generating ranked hypotheses with targeted instrumentation plans. The process follows an observe, analyze, hypothesize, and verify loop before surfacing steps to developers.
What is the biggest risk in AI-generated debugging steps?
Hallucination is the primary risk. AI systems can fabricate line numbers or variable names when not constrained to verified runtime evidence. The deterministic evidence sandwich approach mitigates this by requiring all AI claims to be validated against real code facts.
How do multi-agent debuggers differ from single-model AI debuggers?
Multi-agent systems assign specialized agents to log analysis, code path validation, and root cause synthesis, producing confidence-ranked outputs and visual flowcharts. Single-model debuggers handle all tasks with one LLM, which reduces accuracy on complex, multi-system bugs.
Why is instrumentation cleanup required after AI debugging?
Leftover log points and tracers degrade runtime performance and can introduce new failures. The Debug Probe six-phase workflow treats cleanup as a mandatory final step, not an optional one, to prevent instrumentation from becoming a production liability.
Can AI debugging steps be trusted in production without human review?
No. Production AI debugging relies on replay environments, CI quality gates, and human validation to confirm that AI-generated steps produce the predicted behavior. Fully autonomous AI debugging without human oversight increases the risk of incorrect fixes reaching production.