Automated error reporting is the process by which software automatically captures, groups, and reports runtime errors to development teams without manual intervention. The industry term for this practice is automated error tracking, and it covers everything from SDK instrumentation and stack trace analysis to fingerprinting, session replay linkage, and AI-generated fix suggestions. Teams that implement it well reduce resolution time by up to 50% compared to manual log searching. The examples of automated error reporting covered here show how each mechanism works and where it fits in a real development workflow.
1. Examples of automated error reporting: error capture via SDK instrumentation
SDK instrumentation is the most common starting point for automated error tracking. A lightweight SDK sits inside your application, listens for unhandled exceptions, and fires a structured payload to a reporting dashboard the moment something breaks. Setup can take as little as 5 minutes with API key initialization, which means even small teams can get coverage fast.
The payload typically includes:
- Stack trace. The full call chain from the point of failure back to the entry point.
- Request context. HTTP method, URL, headers, and response codes at the time of the error.
- Environment metadata. App version, OS, browser, and deployment environment.
- User identity. An anonymized user ID that links the error to a specific session without exposing personal data.
Pro Tip: Instrument both your frontend and backend with the same SDK vendor when possible. Cross-layer correlation lets you trace a frontend exception back to the exact API call that triggered it.
2. Breadcrumb and local variable capture

Stack traces tell you where an error occurred. Breadcrumbs and local variable snapshots tell you why it happened. Breadcrumbs are chronological event trails recorded in memory before a crash: button clicks, navigation events, network requests, and state changes. When the error fires, the SDK attaches the last N breadcrumbs to the report.
Local variable capture goes one step further. At the exact frame where the exception is thrown, the SDK records the values of in-scope variables. In production environments where you cannot attach a debugger, this is often the only way to reproduce a race condition or a null reference that only appears under specific data conditions. Teams that enable both features cut their average time to reproduce a bug significantly compared to teams relying on stack traces alone.
3. Stack trace fingerprinting and deduplication
A single bad deployment can generate thousands of identical error events within minutes. Without deduplication, your dashboard becomes noise. Fingerprinting creates a stable hash from the error type, message, and normalized stack frames, then groups all matching events into a single issue record.
The normalization step is what makes fingerprinting reliable. Line numbers shift when code is minified or recompiled, so a naive hash would treat the same bug as a new issue after every build. Normalization strips volatile identifiers and focuses on the structural shape of the call stack. Effective fingerprinting means a team of five engineers sees one issue to investigate, not 4,000 duplicate alerts.
Pro Tip: Customize your fingerprinting rules for third-party library frames. Most SDKs let you exclude or group frames from libraries you do not own, so noise from upstream dependencies does not pollute your issue list.
4. Automated error grouping and severity prioritization
Grouping errors is only half the job. The other half is telling your team which group to fix first. Automated prioritization algorithms score each issue group using a combination of:
- Error frequency. How many times has this issue fired in the last 24 hours?
- User impact. How many unique users hit this error?
- Regression status. Did this issue appear for the first time after a specific release?
- Crash rate. Does this error terminate the session or is it a handled exception?
Automated triage replaces slow manual log searching with a prioritized queue that mirrors CI/CD speeds. The practical result is that your on-call engineer opens the dashboard and immediately sees the three issues affecting the most users, not a flat chronological list of 200 events. Teams that adopt this model shift from reactive firefighting to a structured repair queue.
5. Linking errors to user sessions and behavior
Knowing that an error occurred is useful. Knowing exactly what the user did in the 90 seconds before it occurred is far more useful. The best error tracking tools link each error event to the full session context: session replay video, API call log, console output, and active feature flags at the time of the crash.
The benefits for contextual issue reporting are concrete:
- Session replay. Watch the exact sequence of user actions that preceded the crash. No reproduction steps needed.
- API call log. See which endpoints were called, what payloads were sent, and which responses came back before the error.
- Console output. Capture warnings and info logs that appeared before the exception, revealing silent failures that preceded the crash.
- Feature flag state. Know which experiments were active for that user, which is critical for catching bugs introduced by A/B test variants.
This contextual linkage eliminates the panic-driven debugging cycle where engineers ask users to reproduce steps they cannot remember.
6. Automated source code linkage for root cause analysis
Source code linkage connects an error report directly to the offending line in your repository. Automated root cause analysis uses source maps or symbol files to translate minified or compiled stack frames back into readable code, then hyperlinks each frame to the exact commit in your version control system.
This feature changes how engineers interact with error reports. Instead of copying a stack trace into a code editor and searching manually, the engineer clicks a frame and lands on the relevant line in GitHub or GitLab. When combined with blame data, the report also shows who last modified that line and when, which accelerates the conversation between the engineer who introduced the bug and the one fixing it.
7. Automated fix generation pipelines
The most advanced form of automated bug reporting goes beyond detection. Automated fix pipelines clone the repository at the failing commit, analyze the error context with AI, generate a patch, validate it against the test suite, and open a pull request automatically. This is not science fiction. Several platforms offer this as a production feature for well-tested codebases.
The practical constraint is test coverage. An automated patch that breaks untested code paths creates more problems than it solves. Teams that get the most value from fix pipelines maintain high unit test coverage and use the automated PR as a starting point for human review, not a final answer. Coevy's upcoming AI agent takes a related approach: it reads actual source code rather than documentation, so its debugging assistance is tied to what the code actually does rather than what the docs say it does.
8. Feature comparison across automated error reporting categories
Different platform categories make different trade-offs. The table below compares typical feature availability across four generic platform types.
| Feature | Lightweight SDKs | Integrated observability platforms | Mobile-first tools | All-in-one solutions |
|---|---|---|---|---|
| Error capture | Yes | Yes | Yes | Yes |
| Deduplication and fingerprinting | Basic | Advanced | Advanced | Advanced |
| Severity prioritization | Manual | Automated | Automated | Automated |
| Session replay linkage | No | Partial | Yes | Yes |
| Source code linkage | Partial | Yes | No | Yes |
| Automated fix suggestion | No | No | No | Yes |
| Free tier availability | Yes | Partial | Yes | Partial |
Free tiers typically cover 5,000–6,000 error events monthly for small teams, with paid plans starting around $26 per month. That pricing gap between lightweight SDKs and all-in-one solutions reflects the cost of session replay storage and AI-powered features.
9. Situational best practices for choosing your approach
The right automated error reporting setup depends on your stack, team size, and debugging priorities. Tool choice depends heavily on development stack, and the wrong category creates overhead without payoff.
Use these criteria to match your situation:
- Mobile-first teams should prioritize stability metrics, crash-free session rates, and symbolication quality. Session replay is less critical than reliable crash grouping across OS versions.
- Full-stack web teams get the most value from platforms that combine error monitoring with session replay and API call logging. The ability to watch a user crash is worth the added cost.
- Small teams on a budget should start with a lightweight SDK on the free tier, add fingerprinting rules, and upgrade only when the event volume or context depth demands it.
- Teams with mature CI/CD pipelines should evaluate automated fix generation. The prerequisite is a test suite with meaningful coverage. Without it, automated patches are unreliable.
- Teams using AI bug prioritization benefit most from platforms that expose severity scores via API, so the prioritization data feeds directly into sprint planning tools.
The common mistake is buying an all-in-one platform before the team has established basic fingerprinting and grouping hygiene. Start with capture and deduplication. Add context linkage once the noise is under control.
Key takeaways
Automated error tracking delivers the most value when capture, deduplication, and session context work together as a single pipeline rather than separate tools.
| Point | Details |
|---|---|
| Start with SDK instrumentation | Instrument your app with an SDK first. Error capture is the foundation everything else builds on. |
| Fingerprinting cuts noise | Stable hash-based deduplication turns thousands of duplicate alerts into a single actionable issue. |
| Session context speeds fixes | Linking errors to session replays and API logs eliminates the need to ask users for reproduction steps. |
| Prioritize by user impact | Score issues by affected users and crash rate, not just frequency, to fix what matters most first. |
| Match platform to stack | Mobile teams need symbolication quality; web teams need session replay. Choose accordingly. |
Why I think most teams implement error reporting backwards
Most teams I have seen set up error reporting by installing an SDK, glancing at the dashboard once, and calling it done. The alerts pile up, engineers mute the notifications, and the tool becomes shelfware within a month. The problem is not the tool. It is the order of operations.
The teams that actually benefit from automated error tracking spend their first week on fingerprinting rules, not feature exploration. They define what a "unique issue" means for their codebase before they look at a single alert. That discipline is what separates a useful error queue from a noise machine.
The second thing I have seen teams get wrong is treating session replay as a luxury. It is not. Watching a user crash your app for 90 seconds is worth more than three hours of log analysis. The moment you see a user frantically clicking a broken button before the exception fires, your mental model of the bug changes completely. That visual context is what makes the fix stick.
The trend I find genuinely interesting is the shift toward automated fix pipelines. The constraint is not the AI quality. It is test coverage. Every team I have seen struggle with automated patches had the same problem: their tests checked the happy path and nothing else. Fix your tests first. Then let the automation handle the patches.
— Dizzy
How Coevy fits into your error reporting workflow
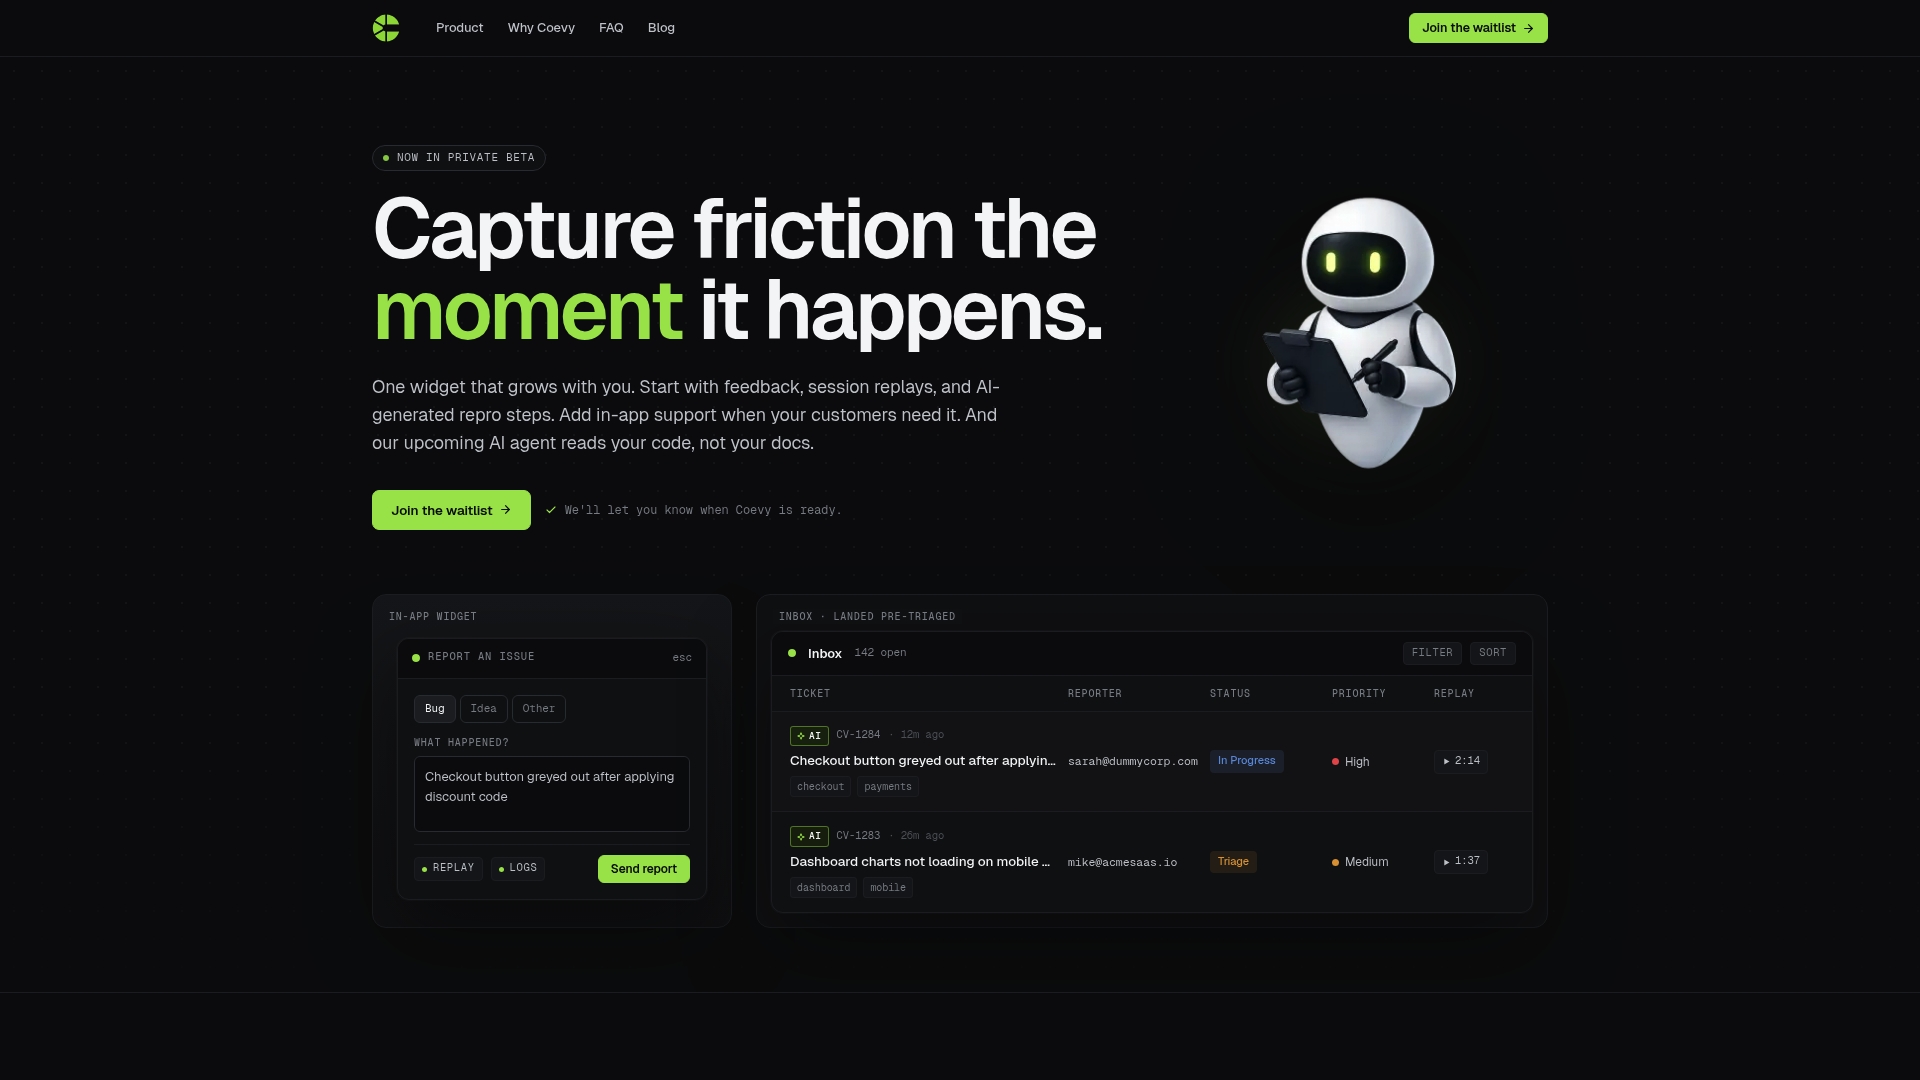
Coevy captures user friction the moment it happens, attaching session replays, AI-generated reproduction steps, and full contextual data directly to every bug report. You do not need to ask users what they did before the crash. Coevy records it automatically and delivers it to your team in a format that is ready to act on. Its AI-powered auto-tagging and prioritization mean your engineers see the issues that matter most, not a flat list of everything that went wrong. For teams that want automated bug reporting with session context built in from day one, Coevy is worth a close look. It is GDPR-compliant, supports field masking and IP anonymization, and grows with your product from early feedback collection to full support ticket management.
FAQ
What is automated error reporting?
Automated error reporting is the process by which software automatically captures, groups, and routes runtime errors to development teams without manual log searching. It typically involves SDK instrumentation, fingerprinting, and dashboard delivery.
How does error fingerprinting reduce noise?
Fingerprinting creates a stable hash from the error type, message, and normalized stack frames, grouping thousands of duplicate events into a single issue. This prevents alert fatigue and keeps engineering queues manageable.
What is the difference between error capture and error tracking?
Error capture refers to the initial detection and recording of an exception. Error tracking is the broader system that groups, prioritizes, and routes captured errors through a resolution workflow.
Do automated error reporting tools link to user sessions?
The best error tracking tools link each error to session replays, API call logs, console output, and active feature flags at the time of the crash, giving engineers full behavioral context without asking users to reproduce the issue.
How much do automated error reporting tools cost?
Free tiers typically cover 5,000–6,000 error events per month for small teams. Paid plans start around $26 per month, with costs rising based on event volume, session replay storage, and AI-powered features.