Session replay is defined as a pixel-accurate recording of a user's browser session, capturing DOM event streams, console logs, network requests, and environment snapshots to reconstruct exactly what happened before a bug occurred. To embed session replay for user issue diagnosis means placing that recording capability directly inside your web app, so every support ticket arrives with a full technical context attached. Product teams that do this stop asking users to describe what went wrong. They watch it instead. The result is faster root cause analysis, fewer escalations to engineering, and a support workflow that runs asynchronously rather than through live screen-sharing calls.
What essential technical data should be captured when embedding session replay?
Effective session replay starts with capturing the right signals. Automatic collection of this context accelerates triage far more than any manual description a user could provide. The goal is to reconstruct the full technical state of the browser at the moment an issue occurred.
The core data streams to capture are:
- DOM event streams: Every click, scroll, input, and navigation event, recorded in sequence so you can replay the exact user path.
- Console logs: JavaScript errors, warnings, and custom log statements that reveal what the application was doing internally.
- Network requests: HTTP calls with status codes, response times, and headers, so you can spot failed API calls or slow endpoints.
- Environment snapshots: Browser type, OS, screen resolution, timezone, and viewport size. A bug that only appears on Safari 17 on macOS at 1280px width will never reproduce without this.
- Annotated user screenshots: A visual frame of the UI state at the moment of failure, useful when DOM reconstruction is incomplete.
Configuring interaction tracking for rage clicks and dead clicks makes problematic sessions discoverable automatically. A user clicking the same button five times in two seconds is a signal, not noise.
| Data Type | Diagnostic Value |
|---|---|
| DOM event stream | Reconstructs the exact user path before failure |
| Console logs | Surfaces JavaScript errors and app state at failure |
| Network requests | Identifies failed API calls and slow responses |
| Environment snapshot | Isolates browser or OS-specific reproduction conditions |
| Rage and dead clicks | Flags friction points without waiting for a user report |

Pro Tip: Set your session replay SDK to capture console errors at the "error" level by default, and promote them to "warn" only after you have confirmed the signal-to-noise ratio. Starting too broad floods your triage queue with non-actionable logs.
How to integrate session replay with backend monitoring and trace correlation?
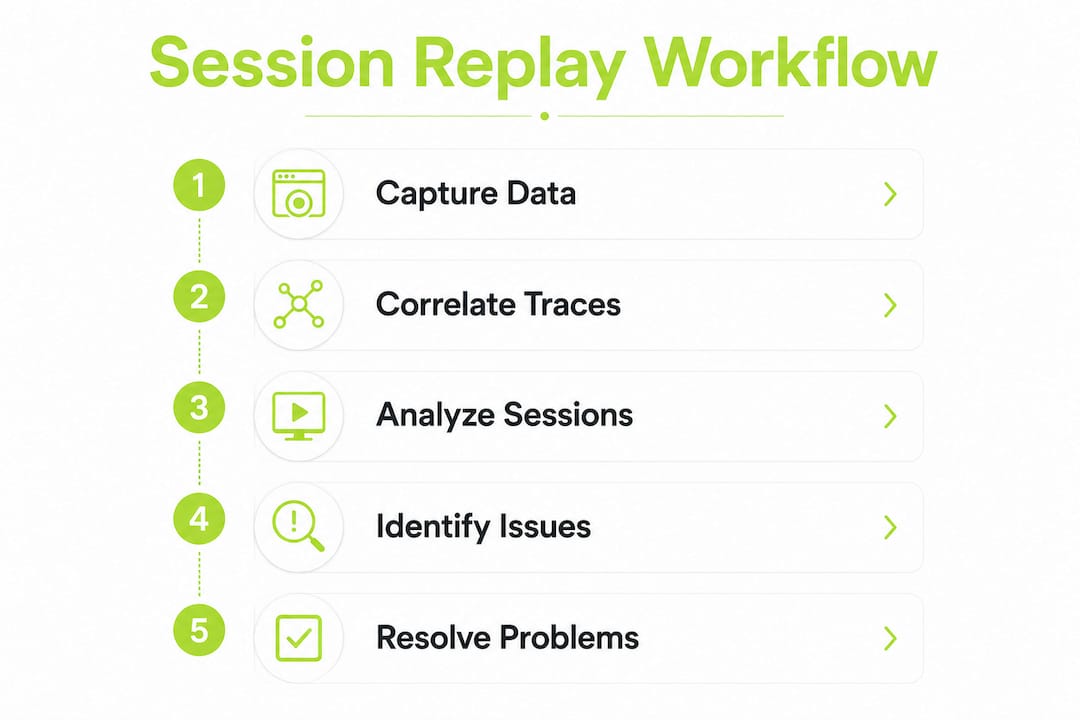
Frontend replay alone does not tell the full story in a complex SaaS product. Bidirectional linking with backend traces is critical for full-stack issue diagnosis. Without it, you see what the user did but not what the server did in response.
The integration process follows these steps:
- Generate a session ID at page load. Assign a unique identifier to each session the moment the page initializes. This ID becomes the shared key between frontend and backend.
- Propagate the session ID in outbound HTTP headers. Inject the session ID as a custom header (for example,
X-Session-Replay-ID) on every API request the frontend makes. This is the link that connects a user click to a server log. - Instrument your backend to read and forward the header. Your backend services should extract the session ID and attach it to their own trace spans. OpenTelemetry's baggage propagation is the standard mechanism for this across distributed services.
- Validate experiment and session metadata. Correlating replay data with backend and A/B testing metadata requires validating experiment IDs alongside session IDs. Without this, analyzing how a UI variant affected a user's journey is nearly impossible.
- Link traces to replays in your APM or observability platform. Tools like OpenTelemetry-compatible APM platforms let you attach the session replay URL directly to a trace span. From a server error, you jump directly to the replay moment that triggered it.
Propagating trace headers and ensuring backend instrumentation detects them gives you full-stack visibility in a single investigation context.
The payoff is bidirectional navigation. A support agent sees a failed checkout in the replay and clicks through to the exact backend trace. An engineer sees a 500 error in the APM dashboard and jumps directly to the session replay that triggered it. Failure to correlate this metadata forces teams to guess during root cause analysis, which increases mean time to resolution.
Pro Tip: If your backend uses microservices, propagate the session ID through every service boundary using OpenTelemetry's W3C Trace Context standard. A session ID that stops at the API gateway is useless for diagnosing errors in downstream services.
For a deeper look at how this fits into QA workflows, the session replay QA guide covers linking replay metadata with experiment IDs in detail.
What is the recommended workflow for diagnosing user issues using embedded session replay?
A structured investigation workflow turns raw replay data into resolved tickets. The process runs asynchronously, which is the key advantage over live screen sharing.
- Trigger the session replay. Magic links activate replay capture on user-triggered URLs, so users participate without installing extensions or granting screen access. A support agent sends a link; the user clicks it and reproduces the issue naturally.
- Let the user reproduce the issue on their own. The session records automatically. The user does not need to narrate or stay on a call. This eliminates scheduling friction and captures the issue in the user's real environment.
- Review the session asynchronously. Support agents review recorded sessions anytime, forming hypotheses before escalating to engineering. This prevents lengthy live calls and removes the need for multiple stakeholders to coordinate schedules.
- Annotate the replay with markers. Tag the exact timestamp where the error appears, the console log that fired, and the network request that failed. These markers become the escalation package for engineering.
- Escalate with precision. Engineering receives a replay link with a timestamp, a console error, a failed network request, and the backend trace ID. They skip reproduction entirely and go straight to the fix.
Asynchronous debugging is not just a convenience. It is a structural shift in how product teams handle support. When a support agent can review a session at 9 AM and hand a precise escalation to engineering by 10 AM, the entire resolution cycle compresses. The user never has to explain the problem twice, and engineering never wastes time trying to reproduce an issue they cannot replicate locally.
For intermittent issues, configure your session replay SDK to capture sessions that include specific error events automatically. Do not rely on users to report every occurrence. Let the error trigger the capture.
What privacy and technical best practices ensure compliant and effective session replay embedding?
Privacy is not optional when capturing user sessions. Strict field masking and default deny policies are required before enabling session replay recording in production environments. Getting this wrong exposes sensitive user data and creates regulatory liability.
The non-negotiable practices are:
- Mask all input fields by default. Passwords, credit card numbers, and personal identifiers must never appear in a replay. Apply masking at the SDK configuration level, not as an afterthought.
- Apply browser-side masking policies. Masking must happen in the browser before data leaves the device. Server-side redaction is a fallback, not a primary control.
- Set a sampling rate appropriate to your traffic volume. Capturing 100% of sessions on a high-traffic product generates enormous data volumes and cost. A 10–20% sample of all sessions, combined with 100% capture on error events, gives diagnostic coverage without waste.
- Define a data retention policy before launch. Session replays contain behavioral data. Retain only what you need for active debugging, typically 30–90 days, and delete automatically after that window.
- Document your replay capture in your privacy policy. GDPR and CCPA both require disclosure of behavioral data collection. Coevy's approach includes IP anonymization and field masking as built-in defaults, which reduces the compliance burden for product teams.
Pro Tip: Run a privacy audit on your replay data before going to production. Load a test session and check every form field, modal, and overlay. If any field shows real text instead of masked characters, your configuration has a gap.
The balance between privacy and diagnostic depth is real. Masking too aggressively removes context that would have identified the bug. The right approach is to mask by data sensitivity, not by element type. Mask personal identifiers; capture interaction patterns.
What common challenges arise when embedding session replay for issue diagnosis?
Integration problems are predictable. Knowing them in advance prevents weeks of debugging the debugging tool itself.
- Partial or missing replay data. This usually means the SDK loaded after the user interaction occurred, or the session was sampled out. Fix it by loading the SDK as early as possible in your page lifecycle and by configuring error-triggered capture to bypass sampling.
- Performance impact on page load. Session replay SDKs add network and CPU overhead. Lazy-load the SDK after the critical rendering path completes, and use asynchronous initialization to avoid blocking the main thread.
- Inconsistent trace propagation in distributed systems. Common challenges include inconsistent trace propagation across microservice boundaries. Audit every service in your request chain to confirm the session ID header passes through correctly.
- Multi-experiment environments. When users are in multiple A/B tests simultaneously, session IDs must carry experiment variant metadata. Without this, analyzing UI variant impact on user journeys becomes guesswork. Attach experiment IDs to the session context at initialization.
- Cost overruns from over-collection. Capturing every session on a large product generates storage costs that compound quickly. Use event-based triggers and sampling to control volume, and review your retention policy quarterly.
The session replay developer guide covers SDK initialization patterns and sampling configuration in depth for teams working through these issues.
Key Takeaways
Embedding session replay for user issue diagnosis works when you combine rich technical data capture, backend trace correlation, and privacy-first configuration into a single asynchronous workflow.
| Point | Details |
|---|---|
| Capture the right signals | Record DOM events, console logs, network requests, and environment snapshots automatically. |
| Correlate frontend and backend | Propagate session IDs through HTTP headers and link replays to backend traces via OpenTelemetry. |
| Work asynchronously | Use magic links and recorded sessions so support and engineering never need to coordinate live calls. |
| Mask sensitive data first | Apply browser-side field masking and a default deny policy before enabling production capture. |
| Control volume with sampling | Combine a 10–20% baseline sample with 100% capture on error events to manage cost and coverage. |
The shift I keep seeing teams get wrong
Most product teams treat session replay as a recording tool. They embed it, watch a few sessions, and declare the job done. The teams that actually reduce engineering triage time treat it as an observability layer, not a video player.
The shift from synchronous screen sharing to asynchronous, data-rich diagnosis is the real change. I have watched support teams cut their escalation time significantly, not because the replay showed them something magical, but because the engineer received a timestamped replay link, a console error, and a backend trace ID in a single ticket. No reproduction steps needed. No "can you share your screen?" call scheduled for Thursday.
The privacy tension is real and worth taking seriously. There is a genuine tradeoff between masking everything and capturing enough context to debug effectively. My view is that masking should follow data sensitivity, not element type. A masked password field is non-negotiable. A masked dropdown selection is just noise removal that costs you diagnostic signal.
The future direction is clear. Session replay becomes most powerful when it feeds directly into AI-assisted triage. Coevy's approach of reading actual source code alongside session context points at where this is going: an AI that sees the replay, reads the relevant code path, and generates a reproduction scenario without a human in the loop. That is not a distant possibility. It is the next logical step for teams that have already embedded replay correctly.
The teams that will benefit most are the ones who build the integration right the first time, with proper trace correlation, privacy controls, and asynchronous workflows. The ones who treat it as a quick install will keep scheduling screen-sharing calls.
— Dizzy
How Coevy captures the context your support tickets are missing
Product teams that embed session replay without automatic context attachment still end up asking users to describe what happened. Coevy solves that by attaching session replays, console logs, and AI-generated reproduction steps to every support ticket automatically, the moment a user reports an issue.
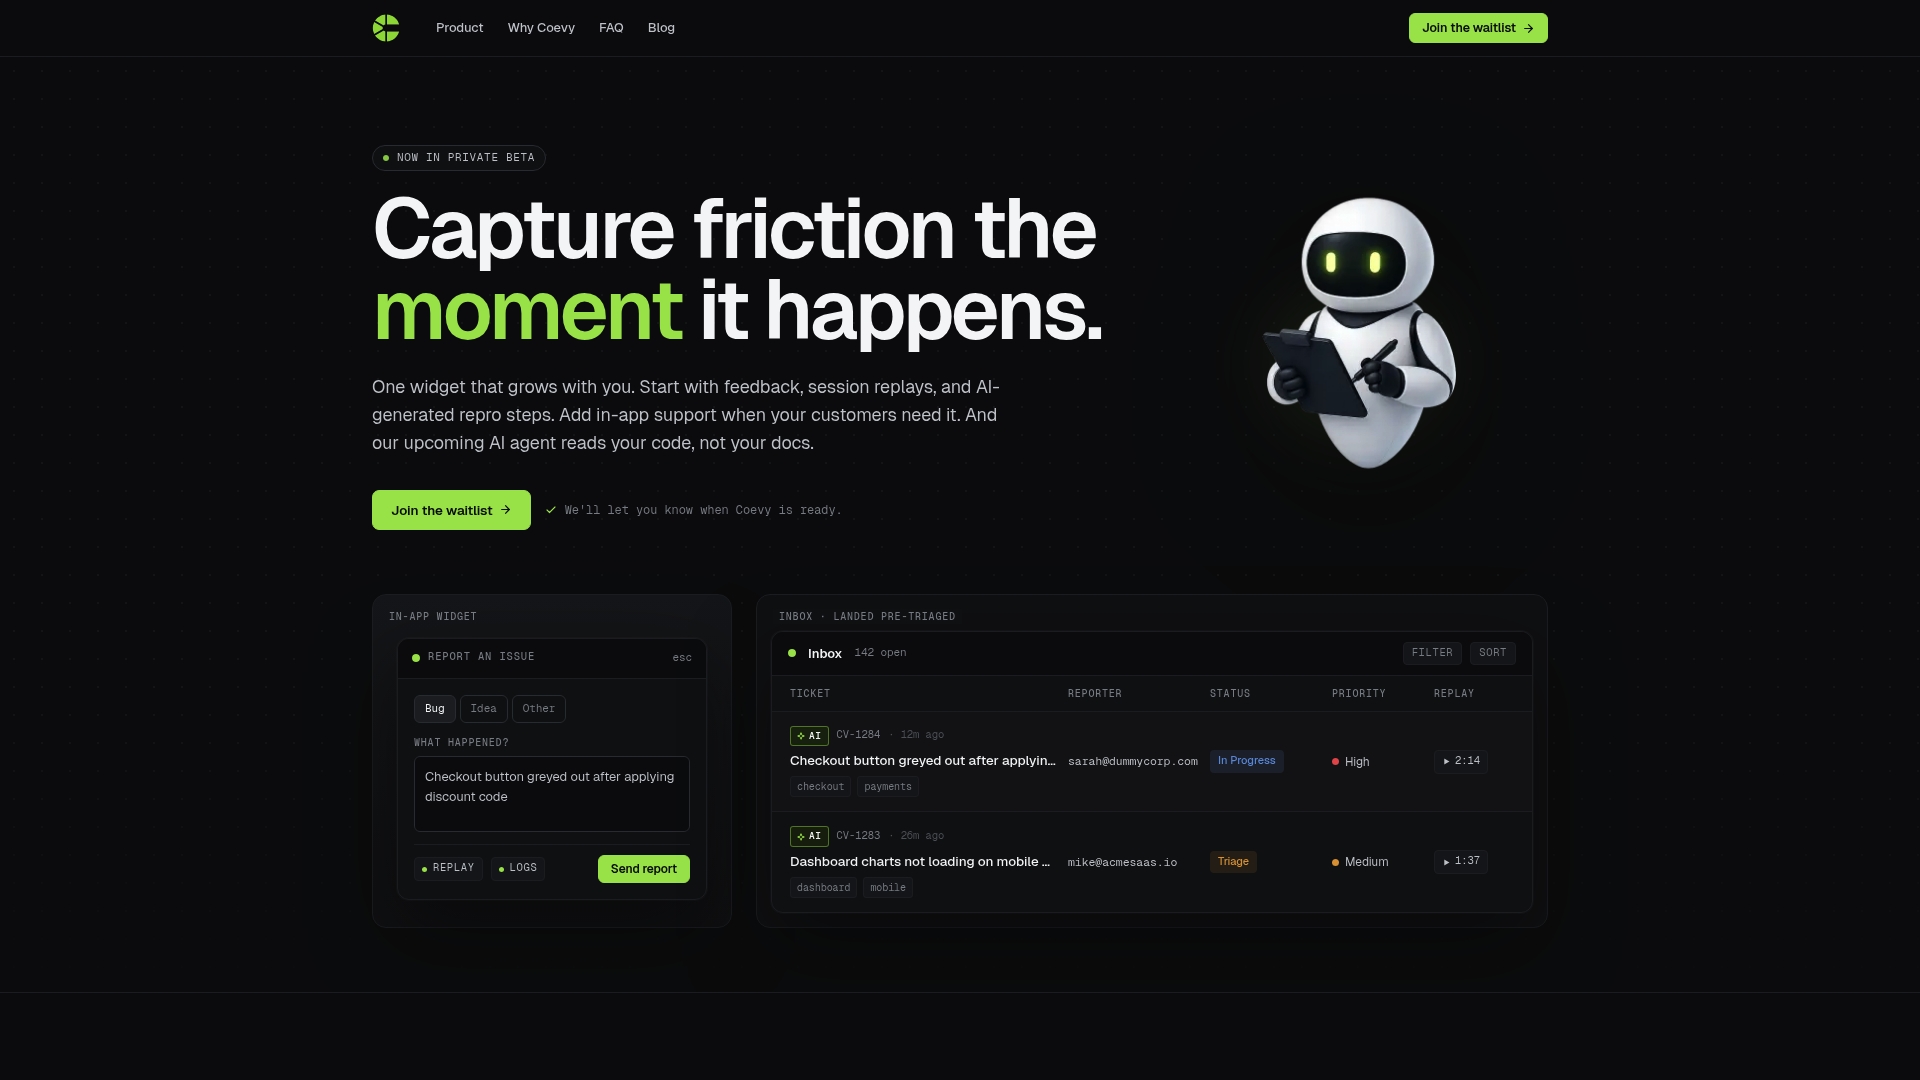
Coevy's embedded widget captures DOM events, network requests, and environment data without any manual configuration from the user. Its GDPR-compliant defaults include field masking and IP anonymization out of the box. The upcoming AI agent reads your actual codebase alongside the session context, generating debugging assistance tied to real code paths rather than generic documentation. For product teams that want session replay built for support, Coevy is built to grow with your product from the first ticket to full-scale triage.
FAQ
What does it mean to embed session replay in a web app?
Embedding session replay means integrating a recording SDK directly into your web application so it automatically captures DOM events, console logs, and network activity during user sessions. The replay data attaches to support tickets without requiring users to describe the issue manually.
How does session replay help with user experience issue tracking?
Session replay lets support and product teams watch exactly what a user did before an error occurred, including clicks, inputs, and network failures. This eliminates guesswork and reduces the time needed to identify the root cause of a reported issue.
What is the role of OpenTelemetry in session replay integration?
OpenTelemetry provides the standard mechanism for propagating session IDs from the frontend through backend services, linking replay data to distributed traces. This connection lets engineers jump directly from a server error to the exact replay moment that triggered it.
How do you protect user privacy when capturing session replays?
Apply browser-side field masking to all sensitive inputs before data leaves the device, and set a default deny policy so recording is opt-in at the configuration level. Platforms like Coevy include IP anonymization and field masking as built-in defaults to support GDPR compliance.
What causes incomplete session replay data?
Incomplete replays typically result from the SDK loading after the user interaction occurred, or from sampling configuration that excluded the session. Loading the SDK early in the page lifecycle and configuring error-triggered capture to bypass sampling resolves most cases.